
Parkinson's disease tracking through mobile app memory test
Healthcare is changing rapidly. The current model of tracking chronic disease patients through sporadic doctor’s visits will soon become antiquated with the enormous innovations in social media, mobile phone technology, and integration of data that have transformed so many fields. These platforms are now being adopted in patient wellness, and are shaking up the status quo for how disease is tracked and treated.
This change is being catalyzed in part through initiatives such as the Apple ResearchKit, a set of tools published last year that allow researchers to build health related apps on Apple mobile phones. Capitalizing on this technology, the Seattle-based non-profit Sage Bionetworks has initiated a number of projects to track disease progress through mobile apps. These projects have been designed in the hopes of providing proof of principle for new ways to manage chronic diseases, and to encourage a shift to more dynamic patient tracking that is commesurate with today’s hi-tech world.
One of these projects developed by Sage, the mPower Parkinson’s project, involves a mobile app that is designed to track the progress of Parkinson’s disease patients. In consultation with Sage, I have spent the last few weeks doing an Insight Data Science project analyzing data from this mobile app. My analysis is the focus of this blog.
The mPower memory test
The mPower mobile app was designed by Sage Bionetworks, using the apple ResearchKit, to track disease progress in Parkinson’s patients. Patients download the app from the apple istore and opt in for the clinical trial. The app then prompts them periodically to complete tasks that track how they are doing. These tasks include a walking gait test, a vocal test, and others. Data from the tasks are collected and stored in a database intended for use by researchers, and become part of a broader mission to improve disease tracking in Parkinson’s between doctor visits. In the future, if a patient’s medicine is not working, the app may signal them that they should see their doctor.
One of the tests within the mPower app is a memory game, which intends to track how the memory of Parkinson’s patients varies on a day-to-day basis. The memory app looks like this:
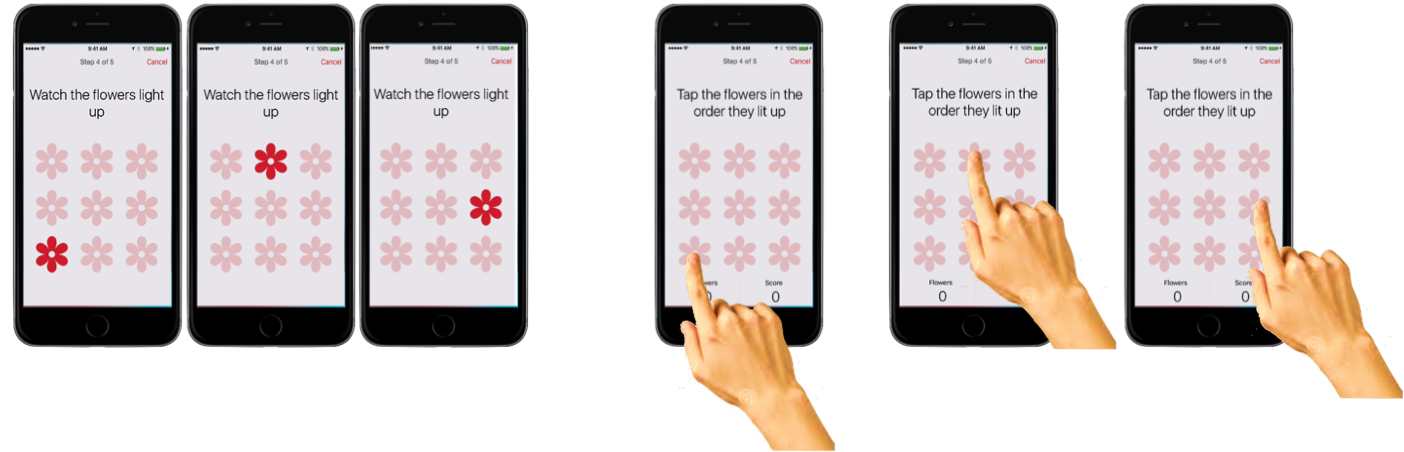
First, the user is prompted about whether they recently took their Parkinson’s medication. Patients can thus be classed into those at their ‘best’ (just took meds), vs. those at their ‘worst’ (immediately before taking medication). Then, a 3x3 grid of flowers appears on the screen, and the flowers light up in a randomized order. Finally, the user is tasked with touching the flowers in the same order they lit up. If they do poorly, the app reduces the number of flowers to a 2x2 grid. If they do well, then the complexity increases to a 4x4 grid. If they continue to do well, the number of flowers they have to remember that lit up also increases.
The game gets quite hard when it gets into 4x4 mode, and you have to remember a sequence of 4, then 5, then 6 flowers. But don’t take my word for it – if you have an iphone, try it yourself. It will be for a good cause. Non-Parkinson’s patients are important in this study too, as you will see shortly.
What can a memory test say about Parkinson’s?
Memory is affected in Parkinson’s, but usually in late stages of the disease. The more common symptoms, which affect nearly all Parkinson’s patients, involve degradation of motor abilities. Motor symptoms of Parkinson’s include tremors, slowness of movement, rigidity, and instability in walking and balancing. Since these symptoms are more common among patients than memory issues, it is unclear if a test of memory will be informative. Therefore, my tasks in this project were twofold:
-
Use the memory game data to build a predictor of which patients have Parkinson’s.
-
Determine which features from that predictor are the most predictive of disease state.
These goals would set a solid basis for future analyses to be carried out by other researchers. Aside from these, there is a bonus goal of predicting whether a patient’s meds are working. I’ll address this goal near the end of the blog.
A peek at the data
The mPower app is available for anybody to download and use, and to use as often as they wish. As a result, unlike in a controlled clinical trial, there are no restrictions on the number of times a user may play the memory game. Therefore, many users played the memory game only once or twice, while a few users played it dozens or hundreds of times. These highly uneven distributions can be seen in the histograms below:

It was important to account for these distributions in some way in order to get meaningful results from the data. For example, if I treated each game record as equal in my analyses, a single Parkinson’s patient who played the memory game 300 times would have the same weight as 300 individuals who each played the game once. This discrepancy could strongly bias my results in unproductive ways (and in fact did in early analyses). I handled this distribution issue by using only a single reading per user - either a single random record, or the average for that user over every time they played the memory game.
The next issue I had to contend with was a large difference in the distribution of ages between Parkinson’s and non-Parkinson’s patients. Below the age of 45, there were practically no Parkinson’s patients in the cohort. While it would be nice to extend my analysis of Parkinson’s to young users of the app, it was unrealistic given the data. Therefore, I put a hard cutoff of ages, and only included users 45 years old or older in my analyses.
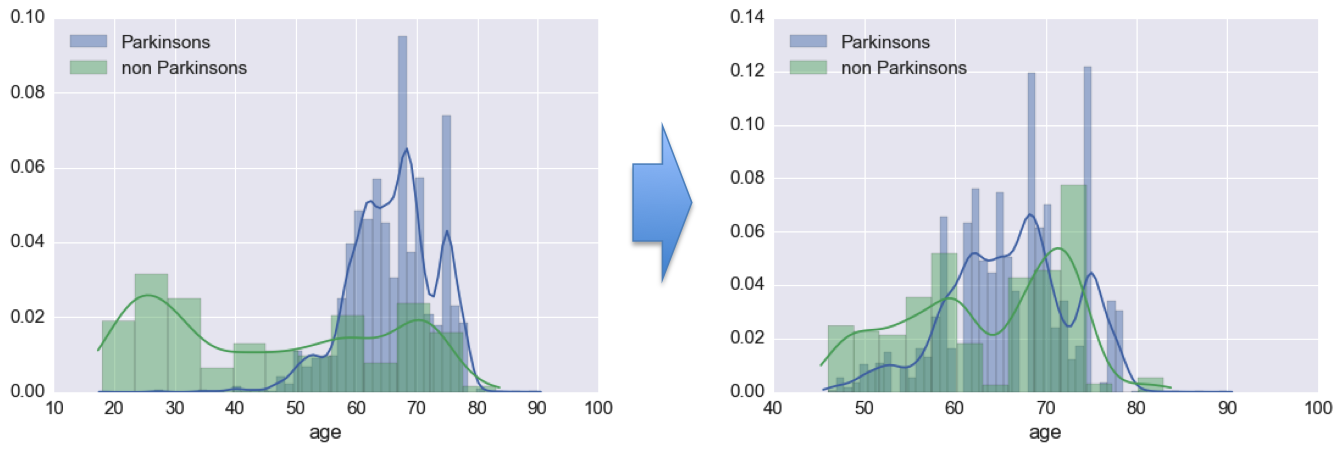
Beyond this rough age matching, I toyed around with resampling the non-Parkinson’s patients to better match the distribution of ages of the Parkinson’s patients. However, I did not proceed with this approach, as it required me cutting out more users than I was willing to for the sake of clean data. When many more users have played the memory game, I believe that better age matching using this sort of a resampling approach may become prudent.
Digging into the features
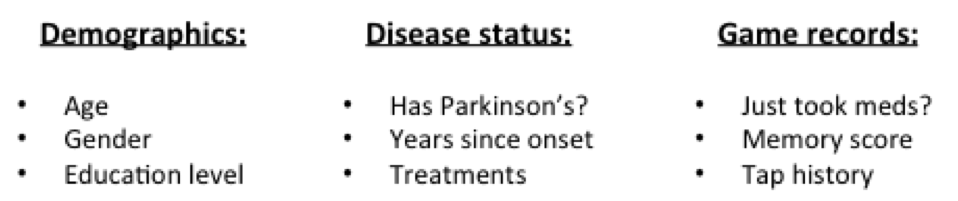
From each user session, the memory game tracks an overall ‘memory score’ (denoting accuracy in touching the flowers), as well as a detailed record of screen taps during gameplay. There is also a record of whether the user is currently on medication, as self reported. Aside from this, I had available each user’s disease status, as well as some demographic information.
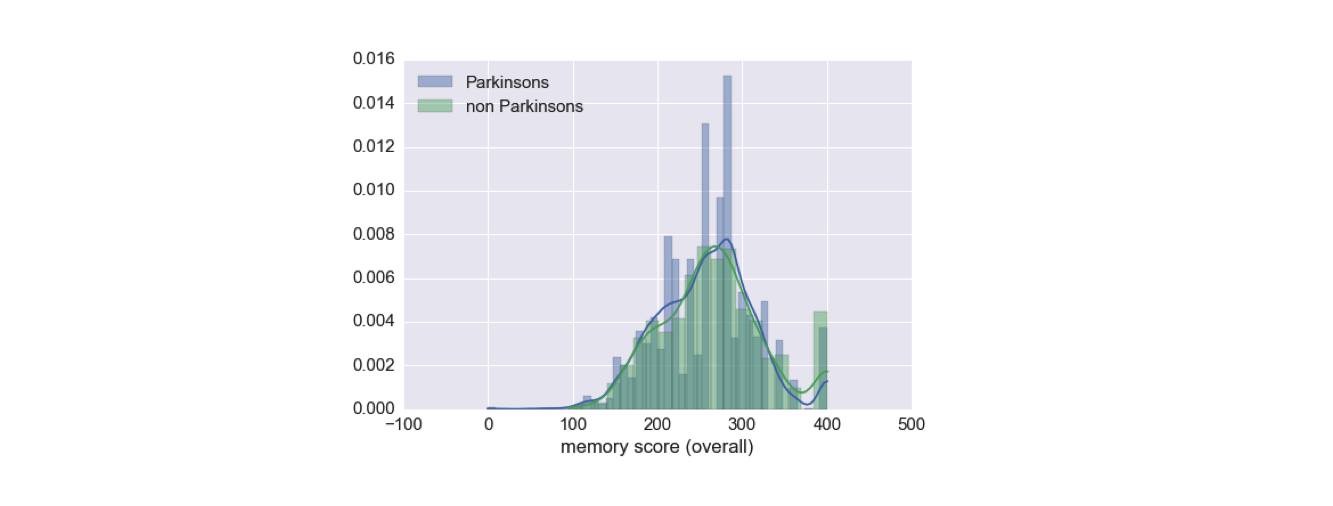
The first thing I did is looked at how the memory game score correlates with users having Parkinson’s. It turned out, this score, taken alone, is not tremendously informative about disease status.
Therefore, I turned to the game records themselves. In these raw records, I had access to the regions considered correct to touch for each flower, the order in which the flowers lit up, and the location and time of each touch by the user.
As I mentioned before, Parkinson’s is primarily a disease of the motor system. Therefore, I hypothesized that there could be two new groups of features, aside from memory-based features like the game score, that might be informative:
-
Features having to do with time delay between touches, which could indicate Bradykinesia (slowness of movement) or Akinesia (difficulty initiating movements).
-
Features having to do with the distance between the intended targets and actual screen taps, which could indicate Dyskinesia (difficulty of controlling movement, e.g., with tremor).
With this in mind, I calculated from the raw data the distance between each ‘successful’ touch and the center of the intended flower, as well as the time delays between touches and also before the first touch.
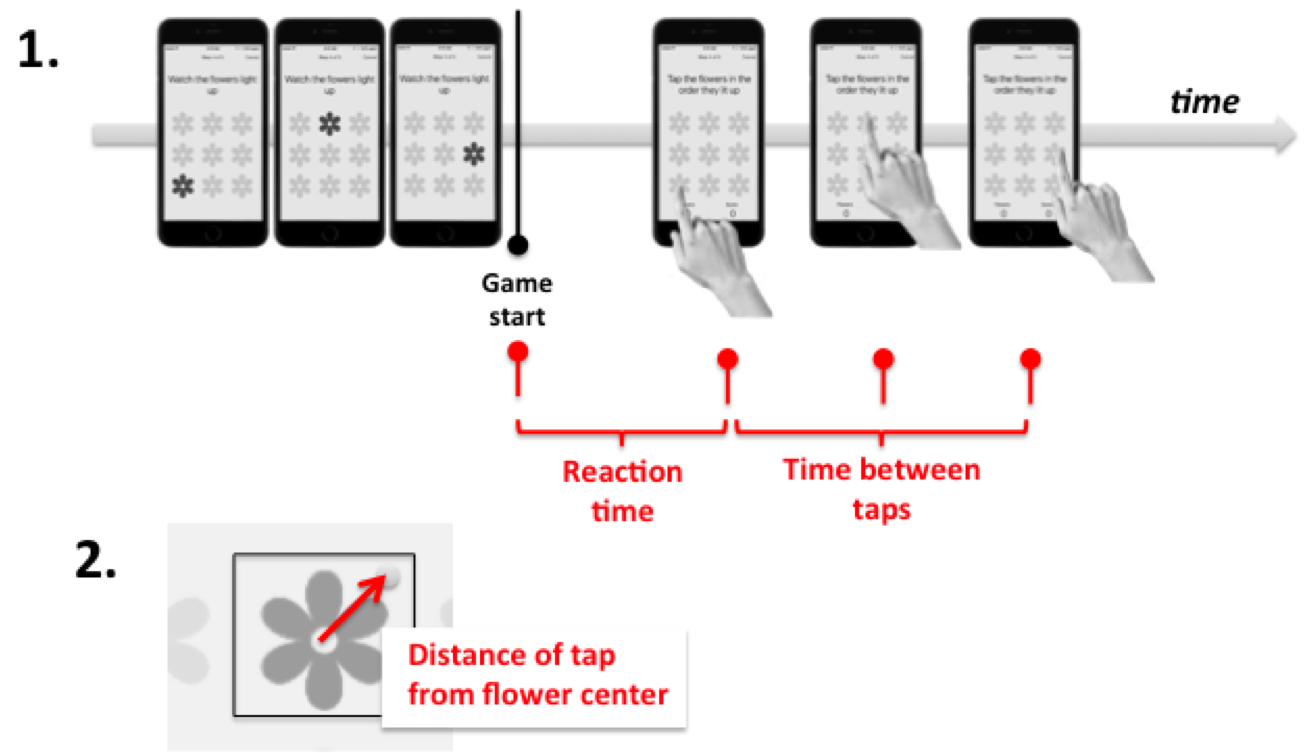
I split the touch timings into two types of features. First, I tracked the ‘reaction time’, i.e., the time before first touch in each game. Next, I averaged the time between each pair of touches after the first one, to get an averaged time between touches. I aggregated each of these features separately for plays of the 2x2 game, the 3x3 game, and the 4x4 game, since the games differ considerably in difficulty. These features, along with the game score, formed my feature set for predicting the health status of people who played the memory game.
Predicting Parkinson’s
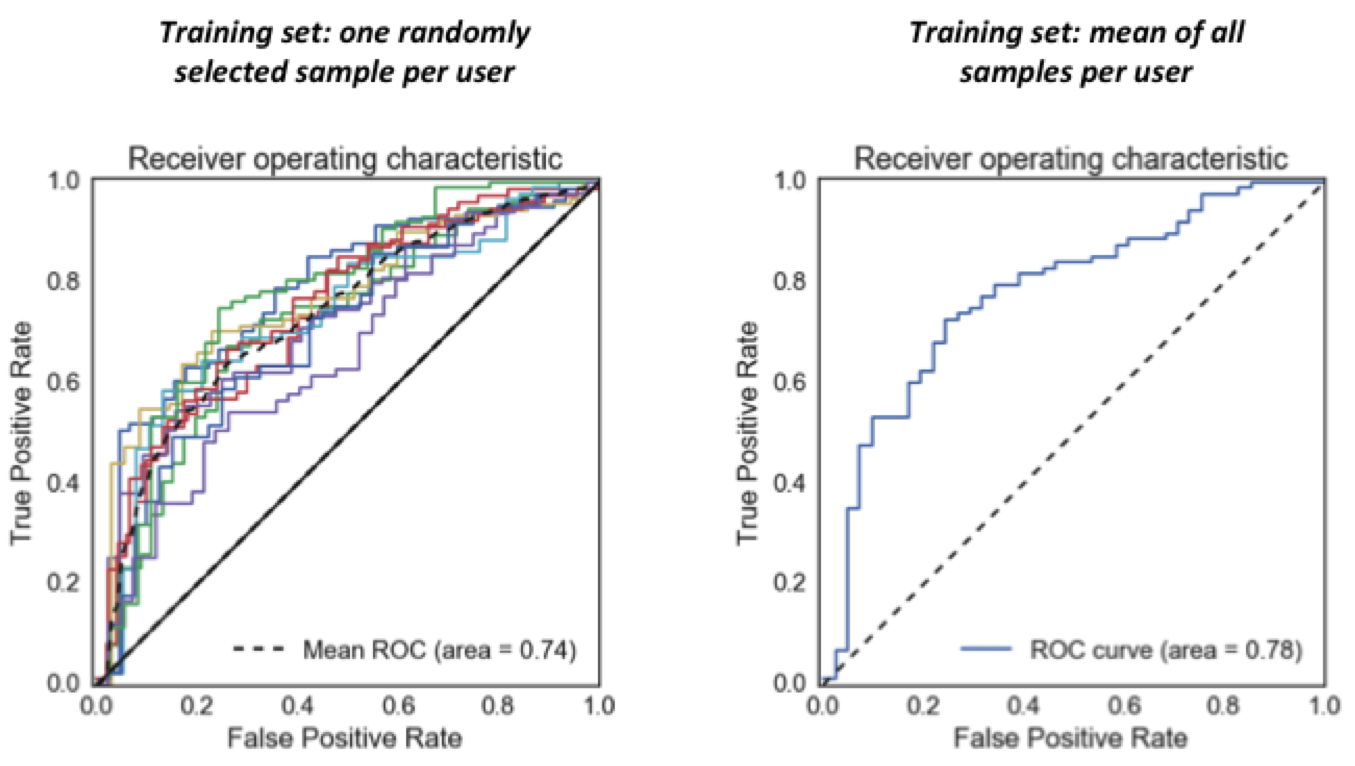
I approached the task of classifying users into Parkinson’s and non-Parkinson’s groups using a logistic regression model. I used gridsearch to pick an L1 regularization term, although the predictiveness of the model did not change much when I altered this term. I split my data 70%/30% into training and test sets and did standard scaling, and then performed machine learning.
As seen in the Receiver Operating Characteristic curves below, my model is able to predict whether users of the memory game have Parkinson’s with an area under the ROC curve of 0.74-0.78, depending on the particulars of the analysis (these curves all show model performance on the held out test data). This means that, given game records from a Parkinson’s patient and a non-Parkinson’s user, the model will give a higher “likelihood of Parkinson’s” score to the actual patient 74-78% of the time. A random predictor would predict at 50%.
Logistic regression calculates coefficients for each feature, which can be interpreted as relative importances of the features for doing the classification (i.e., for predicting whether a game user has Parkinson’s). Note, negative coefficients denote importance as well, just with a negative weighting. Looking at these coefficients can give a lot of insight into what a model is doing.
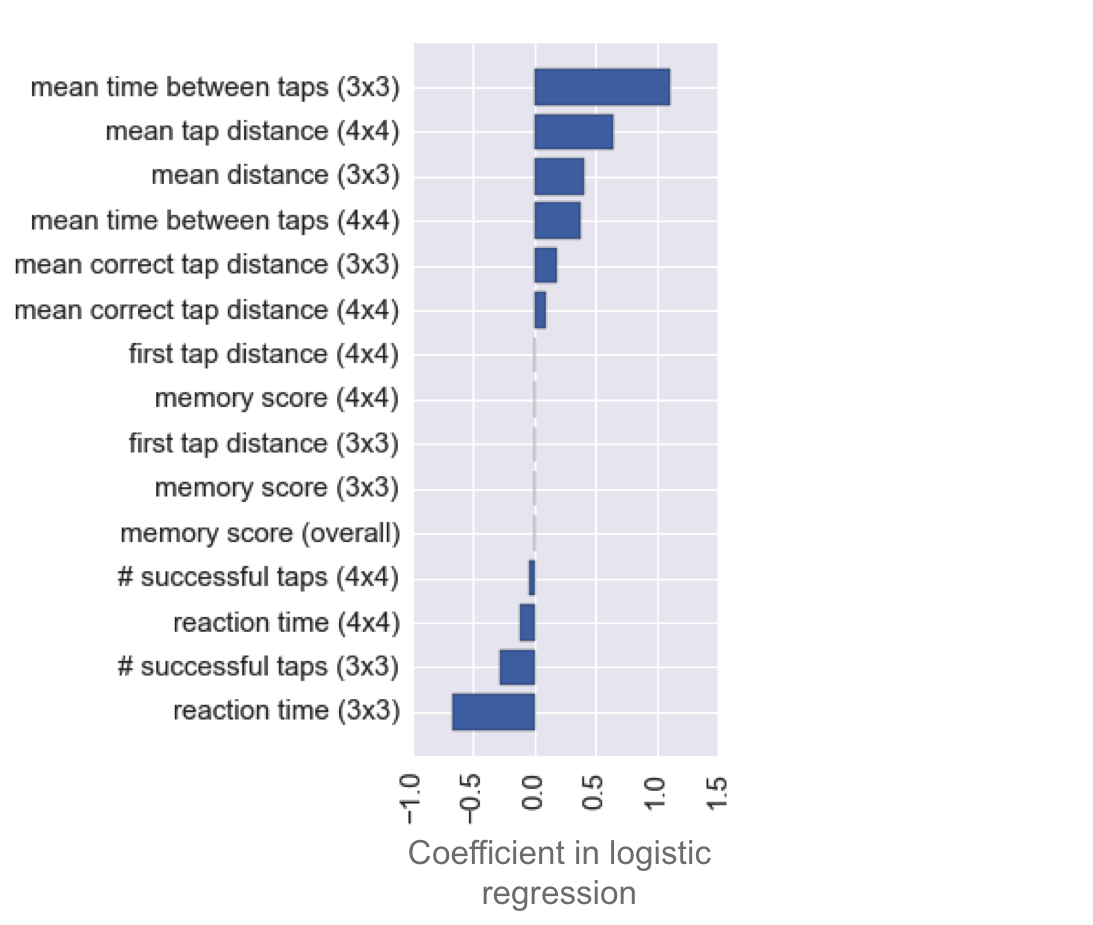
There are three striking observations to be made from the distribution of these coefficients:
-
The most informative features are the mean times between taps (especially in the 3x3 game, but the 4x4 game version is also predictive). I found that removing these features severely reduces predictiveness of the model. Also predictive, although less so, are the mean distances from flower centers.
-
The memory score has very little predictive power. It is last in the ranking of feature importances, with a coefficient near zero. I found that the model’s predictiveness is not affected by removal of the memory score.
-
The reaction time, i.e., the time before the first tap in a given gameplay, is actually predictive of Parkinson’s in the opposite direction of time between taps. That is to say, Parkinson’s patients tend to click faster than non-Parkinson’s patients. More on this in the next section.
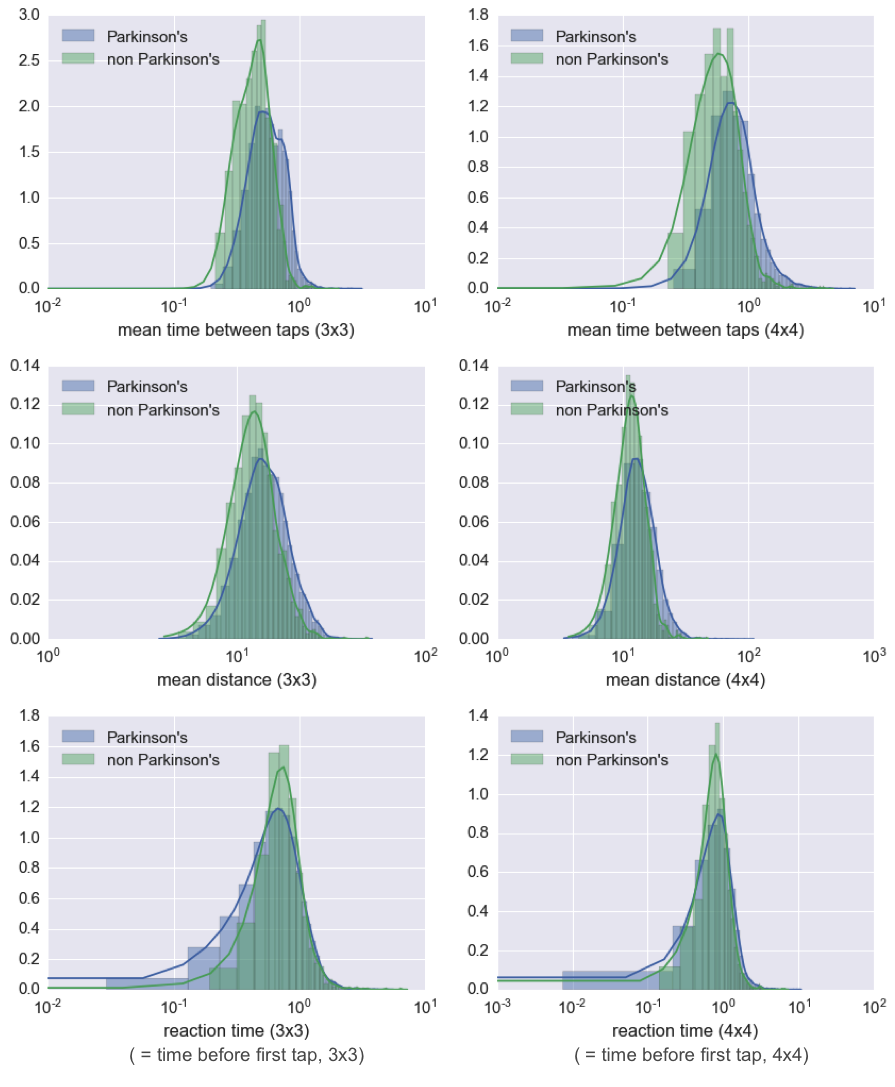
As a follow-up, I took a look at the distribution of Parkinson’s and non-Parkinson’s scores on some of the highest weighted features from my model. As you can see in the following plots, it is clear that, unlike the memory score, these features do hold information about whether a user has Parkinson’s.
The strange case of reaction times
Back to observation 3 from the feature importances:
I found it surprising that the reaction times would be faster for Parkinson’s patients than for non-Parkinson’s patients, since Parkinson’s disease should slow down reaction times, if anything. Here, you can see the reaction times plotted against the mean time between taps for all patients, where each dot is a single patient:
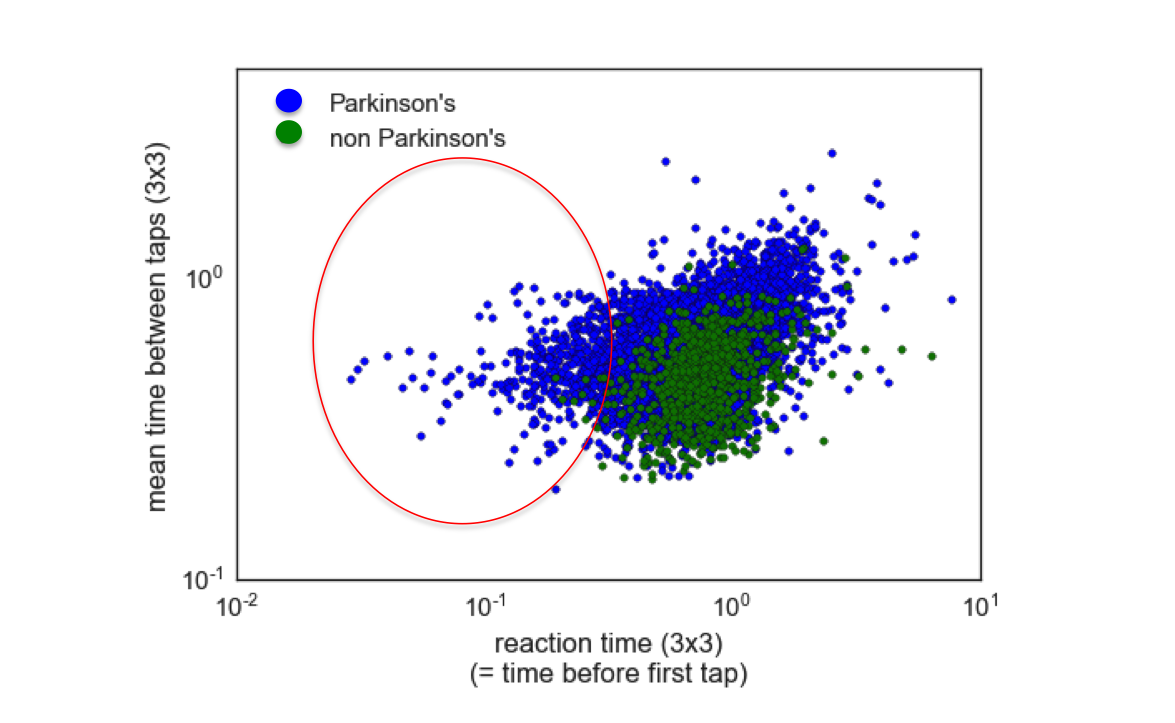
I circled the cohort of Parkinson’s patients who had very fast reaction times in the plot above. My hypothesis for why this effect occurs is that it has to do with the wording of the memory game, which never instructs users to tap quickly, but rather, focuses only on a user clicking the correct order of flowers. Parkinson’s patients are likely clicking quickly because they are employing ‘compensational strategies’, which are techniques that have been developed to overcome the slowed reaction caused by Parkinson’s. Non-Parkinson’s patients, on the other hand, might tend to take a pause to assemble their response before completing the memory task. Identification of fast reactions due to use of compensational strategies is not a desired outcome from the study, as is not fundamentally predictive of the Parkinson’s disease state. Careful rewording of the game instructions might remove this anomoly, and help to emphasize more the features that matter most, i.e., the timing and distance from flower centers.
Do the meds work?
The ‘bonus’ question that I wanted to explore, going beyond whether a user has Parkinson’s, is predicting for a given patient if his or her medicine is working. This hits a fundamental motivation for the mPower study, which is to do better patient tracking in between sparse doctor visits. I tried a few approaches to get at this question, including building models that classify medicated versus non-medicated game records for individual patients, as well as building a model that tries to class records into medicated versus non-medicated categories across all patients. I also did some preliminary modeling to see if I could predict the number of years that a patient had Parkinson’s, the number of years they have been non-medicated, and whether they have had surgery or brain stimulation therapy. None of these analyses returned extremely promising results.
One key source of data that could help future researchers to answer these questions is the International Parkinson and Movement Disorder Society’s Unified Parkinson’s Disease Rating Scale (MDS-UPDRS) survey, a professional health assessment designed to determine the severity of a Parkinson patient’s disease. The UPDRS data is available on Sage’s public mPower research portal, but requires special certifications that I was not able to obtain in the 3 week timespan of this Insight project. Being able to quantify severity of disease in the patients would add a new, highly informative dimension that might allow future researchers to tease out more from the same data.
A note about uncontrolled sampling
A troubling observation I made during the course of this project is that I was able to predict whether a patient has Parkinson’s disease with good accuracy by knowing only his or her gender, education level, and age. Since these predictions contained no features whatsoever derived from the memory game, they are highly suspect, and betray a bias due to uneven demographics of patients playing the game, rather than any helpful signal that would be predictive for patients at large (see also my previous discussion about resampling). To avoid contaminating my models with these biased features, I excluded all of these demographic features outright before doing any modeling. Therefore, no demographic features are included in the analyses presented above. However, given a more demographically balanced dataset (which might exist in the future when many more people have played the memory game, and demographic balancing is possible via resampling), education level and especially age would likely become useful features to be added to a model. It might also be informative under those circumstances to include them as interaction terms with some of the other features, such as time between clicks.
Conclusions
During my time at Insight, I’ve found it gratifying to work on an important problem that can hopefully make an impact on the lives of people with Parkinson’s. Contributing to a much-needed paradigm shift in patient tracking, and learning many new data science tools along the way, has been an exhilarating ride. The major insights from my work are as follows:
-
The memory score is not a predictive feature for Parkinson’s disease. However, timing and distance-from-flower-center features are.
-
The uneven demographics of the users poses a problem for analysis. Increasing the number of unique players of the memory game, and attempting to attract more non Parkinson’s users who match better the demographics (especially age) of the Parkinson’s patients, would likely increase the insights that could be drawn from the data.
-
The faster time-before-first-tap of Parkinson’s patients suggests a potential problem with the wording of the memory game - future versions of the app might consider looking into the game design to fix this issue.
It is my hope that the insights I developed here will be put into use as patient tracking shifts more and more towards mobile.
Accessing the code and data
I did this project as an Insight Data Science fellow, as a consulting project for Sage Bionetworks. The main deliverables for Sage are a body of code for analyzing the mPower memory data, as well as a summary of the analyses (i.e., this blog), for use by other researchers who are interested to use the data. Links to these resources, as well as other related resources for interested researchers, are listed here:
1. My code:
All of the code I wrote for this project is freely available in my mpower_memory repo on github, which you can access here. I did the project using Python, with Pandas for data processing and Sci-kit learn for modeling.
2. A clean summary of my analysis:
I have provided in my github repo for the project a clean Ipython notebook containing the key analyses presented in this blog, which other researchers are free to look at and use. It can be found here.
3. My Insight demo presentation:
See below my short Insight demo presentation on this work!
4. Accessing the mPower memory game data:
The data from the memory test is held in Synapse, Sage Bionetwork’s web portal for data. Anyone can access it if they sign up for a Synapse account and go through a certification procedure. Once a user is certified, they can access the data from the memory test here: mPowerSynapse. Note, you will need to register for a Synapse account to see anything at that link.
Partnered with ![]() and
and  mPower